

When you receive a quote for Turnkey PCB Assembly, the total number at the bottom can feel opaque. Is the component markup reasonable? Are you overpaying for inspection? Why does a 100-unit run cost nearly as much per board as a 10-unit run? Without understanding how the total breaks down into its constituent costs, you cannot identify where savings are possible—or whether the price is fair at all.
This article dissects the typical cost structure of a Turnkey PCB Assembly project, examining each major cost category, how it scales with volume and complexity, and where hidden charges can inflate your bill. Armed with this knowledge, you can make design and sourcing decisions that reduce cost without compromising quality.
While every project is unique, a typical turnkey Pcb Assembly for a mid-complexity board (4-6 layers, 150-300 SMT components, Class 2 inspection) breaks down roughly as follows:
The component bill of materials dominates—and this is where the biggest absolute dollar savings are possible. But the percentages shift dramatically with volume. At prototype quantities (10-50 units), setup costs and minimum order charges inflate the per-unit price of both boards and components, and the assembly labor component is higher because the line runs less efficiently. At production volumes (5,000+ units), economies of scale compress all categories except the BOM, which tends to stabilize at Volume Pricing.
Components typically account for more than half of the total Turnkey Assembly cost, and the range is wide. A simple board with commodity resistors and capacitors might have a BOM cost of a few dollars. A complex board with FPGAs, high-speed serializers, and RF front-end ICs can easily have a BOM cost exceeding $200 per unit even at volume.
Component prices vary enormously with volume. The typical pricing structure from distributors looks like this:
MOQs are a significant cost driver at low volumes. If a component has an MOQ of 3,000 pieces but you only need 50, you pay for 3,000. The excess is either wasted or—hopefully—returned for credit, but restocking fees (typically 15-25%) eat into any recovery. Good turnkey providers negotiate with distributors for lower MOQs or buy from stocking distributors who sell in smaller quantities at a premium. Understanding the MOQ situation for your specific BOM is essential for accurate cost estimation.
Turnkey Assembly providers typically add a markup on component costs—ranging from 5% to 25% depending on the provider, the component type, and the relationship. This markup covers the provider's procurement labor, incoming inspection, inventory carrying cost, and the risk of component price fluctuations between quote and purchase. For commodity passives, the markup percentage tends to be higher (because the dollar amount is small and the procurement effort is relatively large); for expensive ICs, the markup percentage is lower (the dollar amount is large and the procurement is straightforward).
When evaluating turnkey quotes, ask whether the component pricing includes markup or reflects the actual distributor price. Some providers offer "pass-through" pricing where components are billed at cost with a separate procurement fee. This transparency allows you to verify that you are getting fair component pricing.
Turnkey providers may propose component substitutions—alternative parts that are form-fit-function equivalent but less expensive or more available. Substitutions can reduce BOM cost by 5-20% in some cases, particularly for commodity passives where many manufacturers produce equivalent parts. However, substitutions require your engineering approval, and the review process takes time. Providing a pre-approved alternate parts list in your BOM accelerates this process and ensures substitutions meet your performance requirements.
The bare board cost depends on a well-defined set of parameters, each contributing to the total in predictable ways.
Ranked roughly by their impact on bare board price:
Bare board pricing follows a steep volume curve because setup and tooling costs (phototools, drill programs, electrical test fixtures) are amortized over the quantity:
The cost of actually placing and soldering components on the board is driven by the number of placements, the mix of component types, and the production volume.
SMT placement cost is typically quoted per placement (per component placed). Rates vary widely depending on volume:
For a board with 200 SMT components at 100 units, placement cost might be $0.08 × 200 × 100 = $1,600, or $16 per board. At 10,000 units, the same board might cost $0.01 × 200 × 10,000 = $20,000 total, or $2 per board—an 8× reduction per unit.
Through-hole components are significantly more expensive to assemble than SMT because they cannot be placed by high-speed pick-and-place machines. Costs include:
Boards with SMT components on both sides require two passes through the paste-print-place-reflow sequence, roughly doubling the Smt Assembly cost compared to a single-side board. This is why many designers try to consolidate components on one side when possible—the assembly cost savings can be substantial.
The SMT stencil is a one-time setup cost, typically $100-300 for a laser-cut stainless steel stencil. Electroformed stencils—for fine-pitch applications requiring superior aperture wall smoothness—cost $300-600. Nano-coated stencils that improve paste release for small apertures add another $50-150. The stencil cost is the same regardless of volume, making it a negligible per-unit cost at production quantities but a noticeable addition for prototypes.
Quality does not come free. Every inspection and test step adds cost—but skipping inspection is a false economy when the cost of shipping defective boards far exceeds the cost of catching defects during production.
3D SPI equipment measures every Solder Paste deposit before components are placed. Cost is typically $0.01-0.03 per placement, or $1-5 per board for a 150-component board. SPI catches 60-80% of solder-related defects at the earliest and cheapest-to-fix stage, making it one of the highest-value inspection investments.
AOI after placement and after reflow detects missing components, shifted placements, solder bridges, and other visible defects. Cost is $0.50-3.00 per board depending on component density and the number of inspection passes (post-placement, post-reflow). AOI program development for a new board design adds a one-time charge of $200-500.
X-ray inspection for BGA and QFN solder joints is the most expensive per-board inspection step. 2D X-ray costs $2-10 per board depending on the number of BGA components. 3D CT X-ray—providing volumetric images of each joint—costs $10-30 per board and is reserved for the highest-reliability applications.
ICT requires a custom test fixture (bed of nails) that costs $1,000-10,000 to fabricate, depending on the number of test points and board complexity. Per-board test time is 10-30 seconds, with a per-board cost of $0.50-2.00 at volume. The fixture cost is amortized over the production quantity—at 10,000 units, a $5,000 fixture adds only $0.50 per board.
For prototypes and low-volume production, flying probe test avoids the fixture cost entirely. Flying probe test costs $5-20 per board but has longer test times (2-10 minutes per board), limiting its throughput for volume production.
FCT—powering up the board and verifying it works as intended—requires custom test equipment and software. FCT development cost is $2,000-20,000 depending on complexity. Per-board test time ranges from 30 seconds for simple power-and-communication tests to 10+ minutes for comprehensive functional verification. At volume, FCT cost per board is typically $1-5.
Every new Pcb Design incurs one-time setup costs that are independent of production volume. These costs are often underestimated because they do not appear on per-unit price breakdowns.
For a typical mid-complexity board with AOI and flying probe test (no ICT or FCT), total setup costs run $500-2,000. At 100 units, this adds $5-20 per board; at 10,000 units, it adds $0.05-0.20 per board—effectively invisible.
Assembly providers, like all businesses, must cover overhead costs—facility rent, equipment depreciation, utilities, insurance, administrative staff, and IT systems—and earn a profit. These costs(overhead and margin) are embedded in the per-unit pricing rather than broken out as a separate line item.
For a well-run Pcb Assembly operation, overhead and profit margin combined typically represent 5-15% of the total turnkey price. This varies by provider:
Beyond the visible cost categories, several hidden costs can significantly inflate the total project expense if you are not watching for them.
As discussed, MOQ-driven excess purchases are a major hidden cost at low volumes. A BOM that costs $30 per board at the 1,000-unit price level might actually cost $80 per board at 50 units due to MOQ premiums on just a few components. Request a "BOM scrub" from your turnkey provider—a review that identifies MOQ issues and suggests alternatives or lower-MOQ sources.
Changes after production has started are expensive. An ECO may require a new stencil ($100-600), revised AOI programs ($200-500), scrapped work-in-process (the boards already built to the old design), and new component procurement. Even a minor change—swapping one resistor value—triggers a cascade of documentation updates, BOM revisions, and potentially new paste printing requirements. Minimizing ECOs through thorough Design Review before release is one of the most effective cost reduction strategies.
First-pass yield—the percentage of boards that pass all inspections without rework—directly affects cost. If first-pass yield is 95%, 5% of boards require rework. Rework labor for a single board might cost $5-50 depending on the defect complexity. If 2% of boards are scrap (cannot be reworked), the cost of those scrapped boards must be absorbed by the remaining good boards. A 2% scrap rate effectively increases the per-board cost by approximately 2%—small but not negligible for high-value boards.
Shipping costs are often overlooked in cost comparisons. For domestic assembly, ground shipping for a small prototype run might be $20-50. For offshore assembly, international shipping (including customs duties, brokerage fees, and longer transit times that may require air freight for time-critical projects) can add $100-500 per shipment. For heavy or large production runs, shipping can become a significant cost category.
Test fixtures and programs that cost $5,000-20,000 to develop are easily justified at 50,000 units ($0.10-0.40 per board) but may be impossible to justify at 500 units ($10-40 per board). For low-volume production, consider flying probe test instead of ICT, and simple power-up functional test instead of comprehensive FCT. The test coverage is lower, but the cost is far more appropriate for the volume.
Understanding the cost breakdown reveals multiple leverage points for cost reduction.
Not all turnkey quotes are structured the same way, making direct comparison difficult. Here is what to look for:
A transparent quote breaks out at minimum:
The cost of Turnkey Pcb Assembly is not a monolithic number—it is the sum of many individual costs, each driven by different factors and scaling differently with volume and complexity. Components dominate the total at most volume levels, but bare board fabrication, assembly labor, inspection, test, setup, and overhead all contribute meaningfully and offer different leverage points for cost optimization.
The most effective cost reduction strategies operate at the design level—reducing component count, simplifying assembly requirements, and choosing appropriate materials and finishes. These decisions, made early in the design process, have more impact on final cost than any procurement negotiation or provider selection. However, sourcing strategies and volume planning provide additional savings, particularly for the BOM costs that dominate the total.
Transparent quoting—with itemized costs for boards, components, assembly, inspection, test, and setup—is essential for making informed decisions and fair comparisons between providers. A quote that shows only a single total price per unit tells you nothing about where your money is going or where savings are possible.
Understanding the cost breakdown does not just save money on your current project. It builds the engineering judgment to make better cost-performance tradeoffs on every future design.
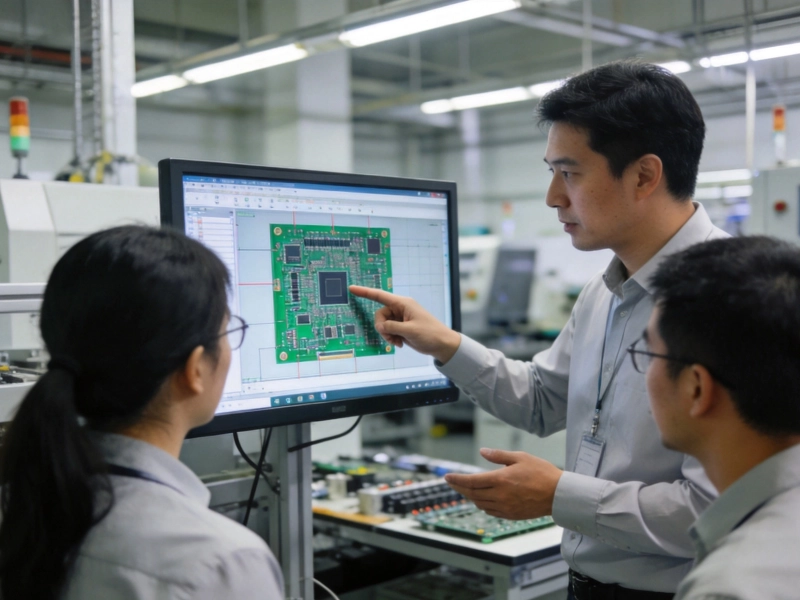
Key Insights on DFM (Design for Manufacturing) in Turnkey ProjectsJuly/26/2026
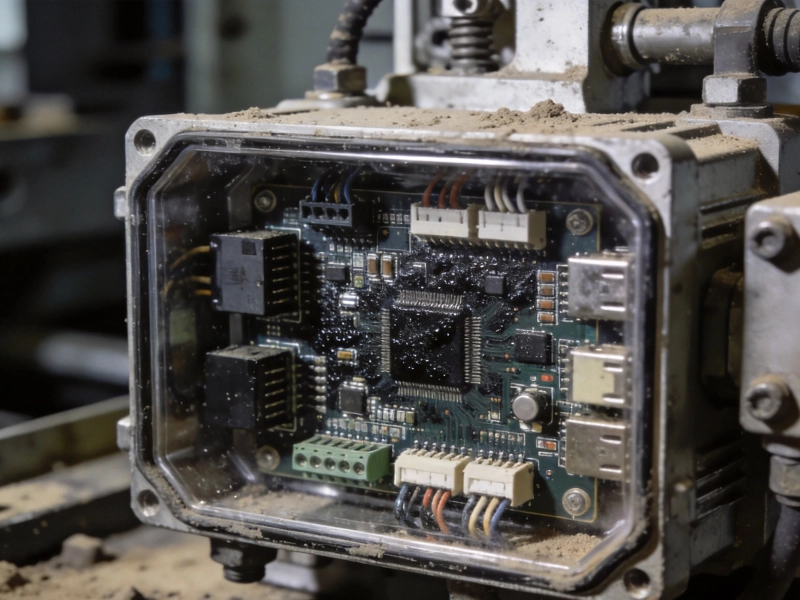
Ruggedized PCB Assembly for Harsh Industrial EnvironmentsJuly/20/2026

Expert Insights on Reducing Supply Chain Risks in Turnkey PCB AssemblyJune/03/2026
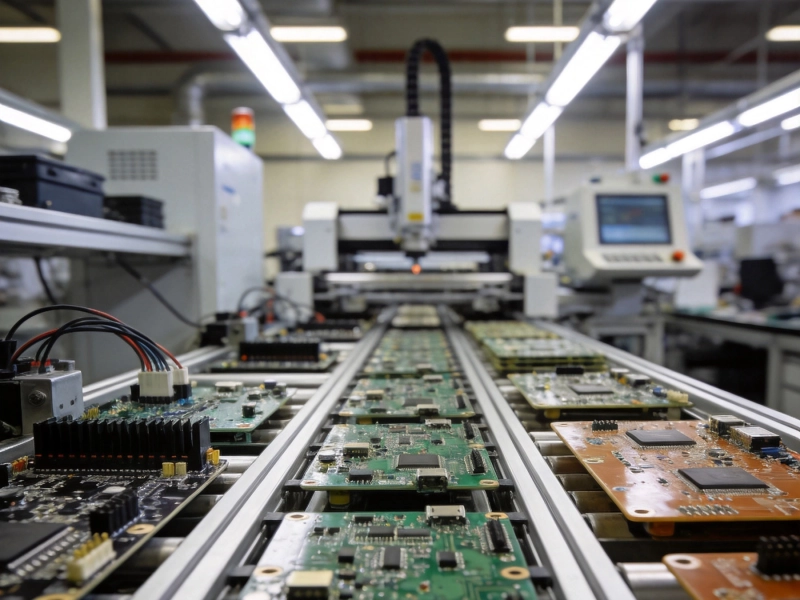
The Best Turnkey PCB Assembly Solutions for Startups and SMEsAugust/15/2026
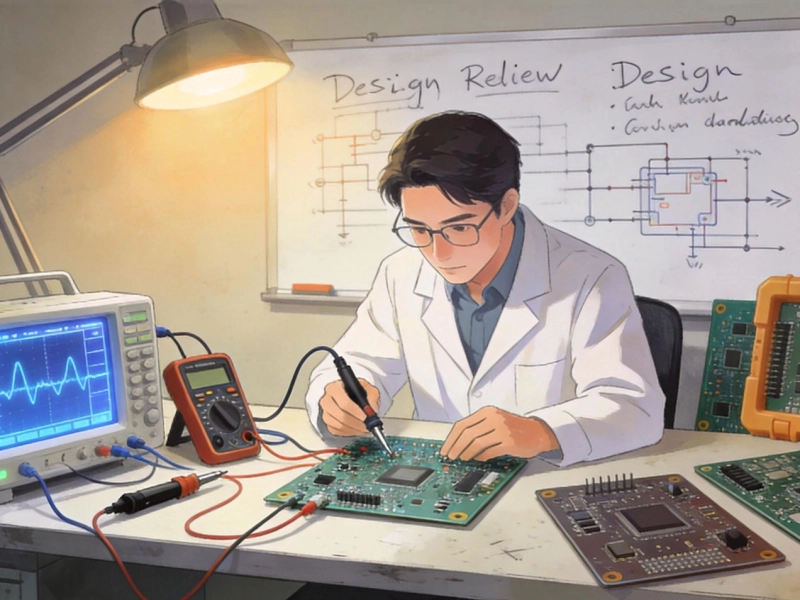
The Ultimate Guide to Turnkey PCB Prototyping for Hardware EngineersMay/26/2026
Turnkey PCB Assembly for Flight Control Systems and Navigation<June/22/2026

Best Turnkey PCB Assembly for Consumer & IoT ElectronicsJune/16/2026
Turnkey PCB Services vs. Consignment: Which Model Fits Your Project?July/27/2026