
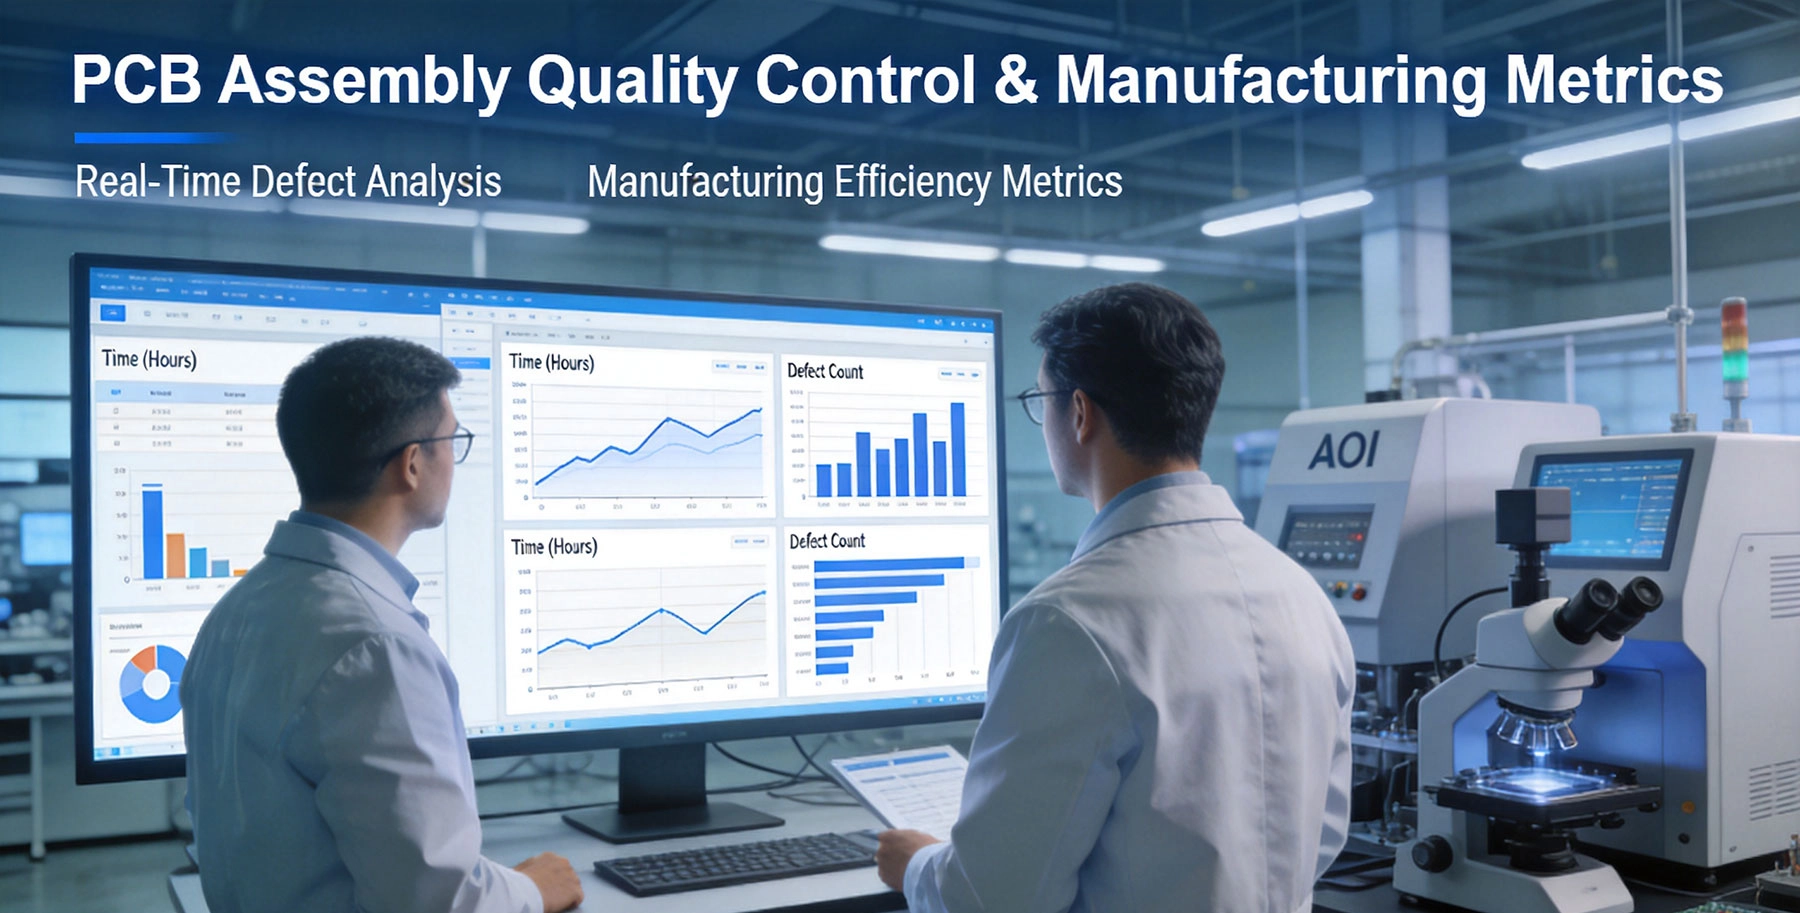
Selecting the right Turnkey PCB Assembly manufacturers isn't a decision you make based on price alone. Your product's quality, reliability, and market success depend heavily on the capabilities and performance of your manufacturing partner. Without clear evaluation criteria, you risk partnering with a manufacturer who can't meet your requirements or who compromises quality to stay competitive.
Metrics provide objective, measurable standards for comparing potential partners. Rather than relying on marketing claims or sales pitches, you can evaluate manufacturers based on quantifiable performance indicators that directly impact your project outcomes. This systematic approach reduces risk and helps you identify partners who will genuinely support your success.
This guide presents the 10 most critical metrics for evaluating Turnkey PCB Assembly manufacturers. Each metric addresses a different aspect of manufacturing capability and quality, giving you a comprehensive framework for assessment.
First-Pass Yield measures the percentage of PCBs that pass all quality inspections without requiring rework or repair. This metric directly indicates manufacturing process stability and quality control effectiveness.
What to look for:
Manufacturers with high FPY rates invest in robust quality control systems, trained operators, and optimized processes. They catch problems before boards reach testing stages, reducing rework cycles and maintaining production schedules. Partners with FPY below 90% often struggle with consistency and may require multiple production runs to deliver acceptable quality.
Lead time reliability matters as much as promised delivery speed. A manufacturer who quotes 2 weeks but frequently misses deadlines causes more disruption than one who consistently delivers in 3 weeks. On-time delivery performance measures how often a manufacturer meets their committed schedule.
Evaluation criteria:
Be cautious of manufacturers who can't provide delivery performance metrics. Those who track and report this data demonstrate commitment to schedule reliability and continuous improvement. Partners without delivery tracking systems often have systemic scheduling problems they're not addressing.
DPMO quantifies assembly defects relative to the total number of components soldered. This standardized metric allows comparison across different board complexities and production volumes. Lower DPMO indicates better assembly precision and process control.
Benchmark targets:
Manufacturers tracking DPMO demonstrate data-driven quality management. They analyze defect patterns, identify root causes, and implement targeted improvements. Partners without DPMO metrics often rely on reactive quality control rather than systematic defect prevention.
Certifications validate a manufacturer's commitment to quality management systems and industry-specific requirements. The breadth and relevance of certifications indicates capability maturity and market focus.
Essential certifications to verify:
Request actual certification documents and verify expiration dates. Manufacturers claiming certifications they don't actually hold or whose certifications are expired signal credibility problems. Focus on certifications relevant to your application area—medical device manufacturers need Iso 13485, defense projects require ITAR compliance.
Turnkey Assembly depends on effective component procurement. A manufacturer's sourcing capability directly affects production feasibility, lead times, and final product cost. Supply Chain management has become increasingly critical in 2026's volatile component market.
Key sourcing metrics:
Manufacturers with strong sourcing networks achieve higher component availability rates and shorter procurement times. They maintain buffer inventory for commonly used parts and have relationships with multiple distributors to mitigate supply risks. Partners relying on single-source procurement or grey market channels face higher availability risks and counterfeit component exposure.
Comprehensive testing ensures assembled boards function correctly before shipment. The range of testing capabilities a manufacturer offers indicates Quality Assurance depth and ability to support demanding applications.
Testing capabilities to evaluate:
Ask which testing stages are standard versus optional, and what percentage of boards undergo each test type. Manufacturers offering comprehensive testing packages invest in Quality Assurance infrastructure. Partners with minimal testing capabilities may offer lower prices but increase your risk of receiving defective boards.
Technical capabilities define what a manufacturer can actually produce. Capability breadth affects your ability to develop diverse products with a single partner, while sophistication determines support for demanding applications.
Capability metrics to assess:
Request capability specifications sheets and examples of challenging projects completed. Manufacturers who've successfully produced boards with specifications similar to your requirements demonstrate relevant experience. Partners who claim broad capabilities but can't provide examples of demanding projects may overstating their technical competence.
Pricing models vary significantly across manufacturers. Transparent pricing structures help you budget accurately and avoid surprise charges. Value structure analysis reveals what you're actually paying for and whether costs align with delivered quality.
Pricing metrics to evaluate:
Request itemized quotes with clear cost breakdowns. Manufacturers providing transparent pricing demonstrate professional business practices and enable accurate budgeting. Partners offering vague quotes or who later bill for unmentioned charges signal business practice problems that affect long-term partnership viability.
Even capable manufacturers can cause project problems if communication is poor. Responsiveness and support quality directly impact your ability to resolve issues quickly and maintain production momentum.
Communication metrics to measure:
Test responsiveness during initial evaluation—note response times to your inquiries and quality of technical engagement. Manufacturers who respond quickly and provide substantive technical feedback demonstrate commitment to customer support. Partners with slow responses or generic answers during evaluation will likely provide worse support during production.
Experience with your specific application area provides valuable context for manufacturing decisions. Manufacturers who understand your industry's requirements can anticipate challenges and optimize processes for your product type.
Experience metrics to consider:
Ask for case studies or project examples in your application area. Manufacturers with relevant experience understand industry-specific challenges and regulatory requirements. Partners without experience in your sector may struggle with application-specific requirements or compliance standards.
Using these metrics effectively requires structured evaluation across multiple potential partners. Here's a practical framework for applying these evaluation criteria:
These metrics don't operate independently—they interact in ways that affect overall partnership quality. Understanding these interdependencies helps you evaluate manufacturers holistically:
Consider these trade-offs when weighting metrics for your specific project requirements. Optimal partnerships balance metric performance according to your priorities rather than achieving maximum scores across all criteria.
Evaluating Turnkey Pcb Assembly manufacturers through these 10 metrics transforms partner selection from subjective judgment to objective assessment. Quantifiable performance data reveals actual manufacturing capability and quality performance, enabling informed decisions that reduce partnership risk.
Each metric addresses a critical aspect of manufacturing performance. Quality metrics (FPY, DPMO, defect rates) indicate process stability and output reliability. Schedule metrics (on-time delivery, lead times) determine project timeline feasibility. Capability metrics (technical sophistication, testing coverage) define what a manufacturer can produce. Business metrics (pricing transparency, communication quality) affect partnership efficiency and problem resolution.
No manufacturer maximizes all metrics equally. Optimal partnerships balance metric performance according to your project priorities and requirements. Prototype development prioritizes technical capability and lead time flexibility. Volume production emphasizes defect rates and pricing efficiency. Regulatory applications weight certifications heavily. Define your metric priorities before evaluation and compare partners systematically against your weighted criteria.
Invest time in thorough metric-based evaluation upfront. The right Pcb Manufacturing partner supports product success through consistent quality, reliable delivery, and responsive support. The wrong choice creates ongoing problems that compound across future projects and product generations. Use this metric framework to identify partners who will genuinely support your manufacturing needs.
For standard PCB assemblies, FPY above 90% is minimally acceptable. Quality-focused manufacturers achieve FPY rates of 95-97% or higher. For demanding applications or complex boards, seek manufacturers with FPY above 95% to avoid extensive rework cycles and quality variability.
Request DPMO data with supporting documentation—quality records showing defect counts relative to total components assembled. Ask for DPMO on projects similar to your complexity level, since defect rates vary by board complexity. Cross-check claims through client references who can confirm actual defect performance.
ISO 9001 and Ipc Standards certifications are most relevant for Consumer Electronics applications. ISO 14001 indicates environmental management commitment increasingly important for consumer markets. UL certification matters for products requiring safety approvals. Medical, defense, and automotive applications require additional specialized certifications.
Review key metrics quarterly for ongoing partnerships. Track FPY trends, defect rates, and delivery performance across projects to identify performance changes early. Annual comprehensive reviews evaluate all metrics against initial benchmarks to assess partnership health and capability maintenance.
Manufacturers without quantifiable performance metrics often lack systematic quality management. This signals potential problems with process control and continuous improvement. Consider whether lack of metric tracking aligns with your quality requirements. For demanding applications, partners without performance data introduce significant risk.

How Turnkey PCB Services Accelerate Time-to-Market for New ProductsSeptember/02/2026
Turnkey PCB Services vs. Consignment: Which Model Fits Your Project?July/27/2026
What Are Turnkey PCB Services?May/26/2026

Turnkey PCB Services vs. Consignment: Which Model Fits Your Project?July/03/2026

The Core Benefits of Outsourcing to Turnkey PCB ServicesJune/04/2026

Essential Questions to Ask Before Hiring Turnkey PCB ServicesSeptember/26/2026

How to Choose the Best Turnkey PCB Assembly Partner in 2026May/26/2026

Best Turnkey PCB Assembly for Industrial & Automation: Built to LastJune/27/2026